📚 Wine Climate Adaptation Series
I've always loved wine. Not just drinking it (though I won't pretend that's not part of the appeal), but everything about it — the terroir, the craftsmanship, the way a good bottle can transport you to a sun-drenched hillside in Provence or a foggy morning in Napa Valley.
But lately, I've been thinking about wine in a different way. Climate change is reshaping our world, and few industries feel it as acutely as wine. Vineyards that have produced exceptional Cabernet Sauvignon for generations are suddenly struggling with heat waves. Harvest dates are creeping earlier. Winemakers are facing an uncomfortable question: What do we plant today that will still thrive in 2050?
That question stuck with me. As someone learning machine learning and data science, I wondered: Could AI help answer it?
This is the story of what happened when I tried.
The Challenge: Planting for a Climate That Doesn't Exist Yet
Here's the problem: planting a vineyard is a 15-year commitment minimum. You don't just toss some seeds in the ground and see what happens. You carefully select grape varieties suited to your climate, prepare your soil, install trellising systems, and wait patiently while your vines mature.
But climate change throws a wrench in this centuries-old process. The climate you're planting for today won't be the climate your vines produce in 15 years. It's like trying to pack for a vacation when you don't know if you're going to the beach or the mountains.
I focused on California's wine regions — Napa, Sonoma, Russian River Valley, Anderson Valley — and a specific question: By 2050, will these cool-climate regions become suitable for warm-climate Rhône varieties like Grenache, Syrah, and Mourvèdre?
These grapes currently thrive in places like France's Rhône Valley and California's Paso Robles — regions that are warmer than Napa today. But if Napa warms up, could these heat-loving varieties become the next big thing?
Phase 1: The Data Hunt (Or: Why This Was Harder Than Expected)
When I started this project, I naively thought: "I'll just download some climate data and train a model. Easy!"
Reader, it was not easy.
The Climate Data Maze
I needed historical climate data for California wine regions going back decades. Not just temperature, but rainfall patterns, extreme heat events, day-night temperature swings (crucial for wine quality), and something viticulturists call "Growing Degree Days" — basically a measure of accumulated heat during the growing season.
Finding this data meant navigating:
- PRISM Climate Group (high-resolution California data at 800-meter grids)
- European Climate Assessment Database (for French Rhône Valley comparison)
- CMIP6 climate projections (future scenarios based on different greenhouse gas pathways)
Each dataset had different formats, resolutions, and quirks. I spent weeks just getting temperature and precipitation data to play nicely together.
The Surprise: I Didn't Need Soil After All
Initially, I thought I'd need detailed soil composition data. Wine is all about terroir, right? Surely soil chemistry matters enormously!
But here's what I discovered: For predicting which varieties can grow where, climate is overwhelmingly dominant. Soil matters tremendously for wine quality and character, but for basic suitability — whether a grape variety will ripen properly — climate is king.
This was a relief because climate data, while tedious, was accessible. Getting detailed soil chemistry for six regions over 27 years would have been a nightmare.
Phase 2: Teaching the Machine to Think Like a Winemaker
With data in hand, I needed to create features that actually meant something for grape growing. Raw temperature isn't enough — you need to capture patterns that winemakers care about.
I engineered 26 different climate features, including:
Temperature patterns:
- Growing Degree Days (GDD): The traditional measure viticulturists use
- Extreme heat days: How often does it get above 95°F?
- Diurnal range: The temperature swing between day and night (critical for flavor development)
- Frost risk: Late spring frosts can devastate a vintage
Precipitation patterns:
- Dormant season rainfall: Grapes need winter rain
- Growing season dryness: Mediterranean varieties prefer it dry when growing
- Variability: How unpredictable is the rainfall year-to-year?
I assembled data for 27 years (2000-2026) across six regions: Anderson Valley, Napa, Russian River Valley, Sonoma, Paso Robles (California), and the Rhône Valley (France). The California regions currently grow cooler-climate varieties. Paso Robles and Rhône already succeed with warm-climate varieties.
The goal: Teach the AI to recognize what makes a region suitable for Rhône varieties, then project whether California's cool regions will develop those characteristics by 2050.
Phase 3: The Models That Worked Too Well (Until They Didn't)
This is where things got interesting.
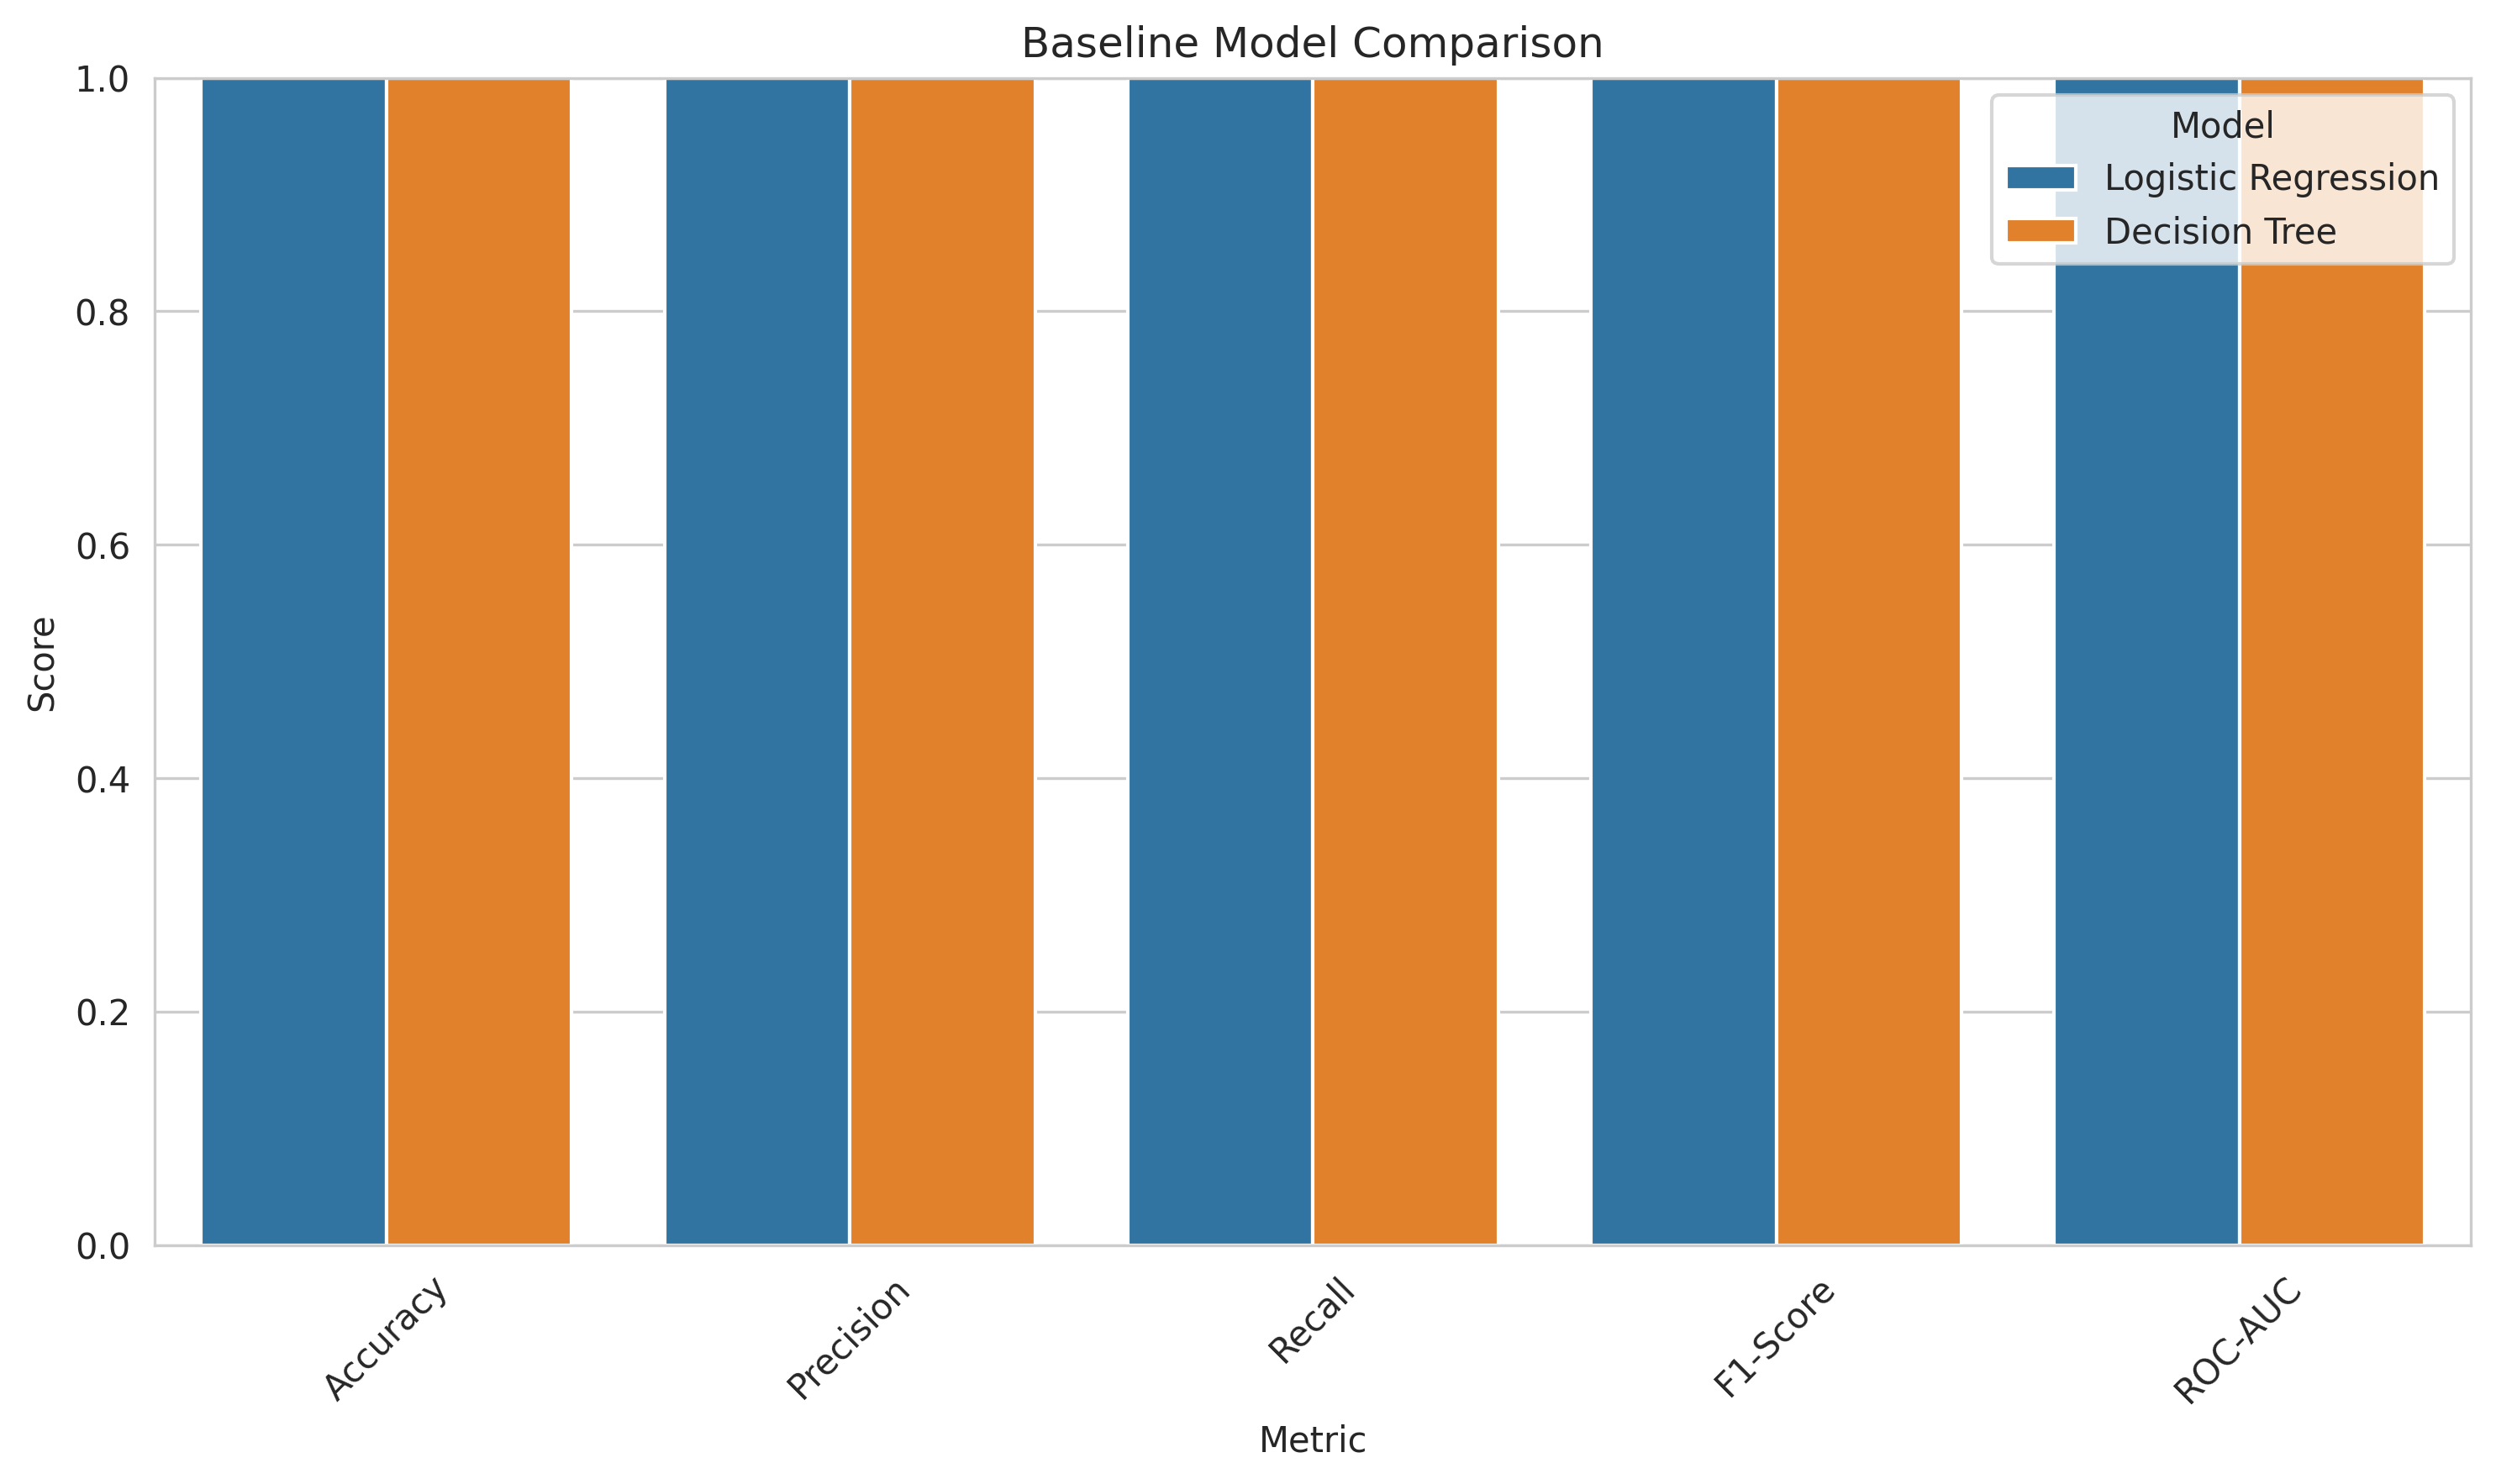
I built several machine learning models — Logistic Regression, Random Forests, XGBoost — and started testing them. And they performed beautifully. I'm talking 96-100% accuracy.
I was thrilled! My models could perfectly predict which regions were suitable for Rhône varieties!
Then I did something every data scientist should do but many don't: I tested them properly.
The Validation Reality Check
Instead of randomly splitting my data (which would mix different years from the same region), I did something called spatial cross-validation. This means: train the model on five regions, then test it on the sixth region it's never seen before.
The accuracy collapsed from 96% to 28%.
Twenty-eight percent.
You could do almost as well by flipping a coin.
Why This "Failure" Was Actually My Most Important Finding
At first, I was devastated. Then I realized: this wasn't a failure — this was the whole point.
The models with 96% accuracy were memorizing regional characteristics rather than learning about climate. They were picking up on things like "Napa has this specific combination of soil and terrain features" rather than understanding "regions with these temperature patterns are suitable for Rhône varieties."
This matters enormously for climate projections. Climate is changing, but the fundamental geography isn't. If my model learned "Napa = unsuitable" based on fixed characteristics, it can't tell me anything useful about Napa's suitability in 2050 when the climate has warmed but the hills are still in the same place.
The lesson: Sometimes high accuracy is a red flag, not a celebration. If your model can't generalize to new locations, it can't make climate predictions.
Phase 4: Finding a Better Path
When traditional machine learning failed spatial validation, I didn't give up. I changed approaches.
Instead of classification (suitable vs. unsuitable), I used climate analog matching. The idea is beautifully simple:
- Calculate the climate "signature" of known Rhône-suitable regions (Paso Robles, Rhône Valley)
- Measure how similar each California region's climate is to that signature
- Apply projected 2050 warming (+2.0 to 3.0°C based on moderate climate scenarios)
- Recalculate similarities to see which regions are moving toward the Rhône climate pattern
This approach doesn't require the model to generalize geographically — it just asks "how similar is your climate to these proven regions?" It's how viticulture researchers have done climate suitability analysis for decades, and for good reason: it works.
The Discoveries That Surprised Me
Finding 1: Extreme Heat Matters More Than Total Heat
I expected Growing Degree Days — the sum of all heat during the growing season — to be the most important factor. It's what viticulturists have used for nearly a century.
But when I analyzed which features actually drove suitability, extreme heat events were far more important. Specifically:
- 95th percentile maximum temperature (how hot do the hottest days get?)
- Diurnal temperature range (the day-night temperature swing)
- Heat stress days (consecutive hot days)
Growing Degree Days ranked surprisingly low. Why? Because there's a lot of overlap — Rhône Valley has about 1800 GDD, Anderson Valley has about 1900 GDD, but one is perfect for Rhône varieties and the other is too cool. The difference isn't total heat; it's the pattern of heat.
Finding 2: The 2050 Projections
Using climate analog matching with moderate warming scenarios (IPCC SSP2-4.5, roughly +2.5°C globally), here's what I found:
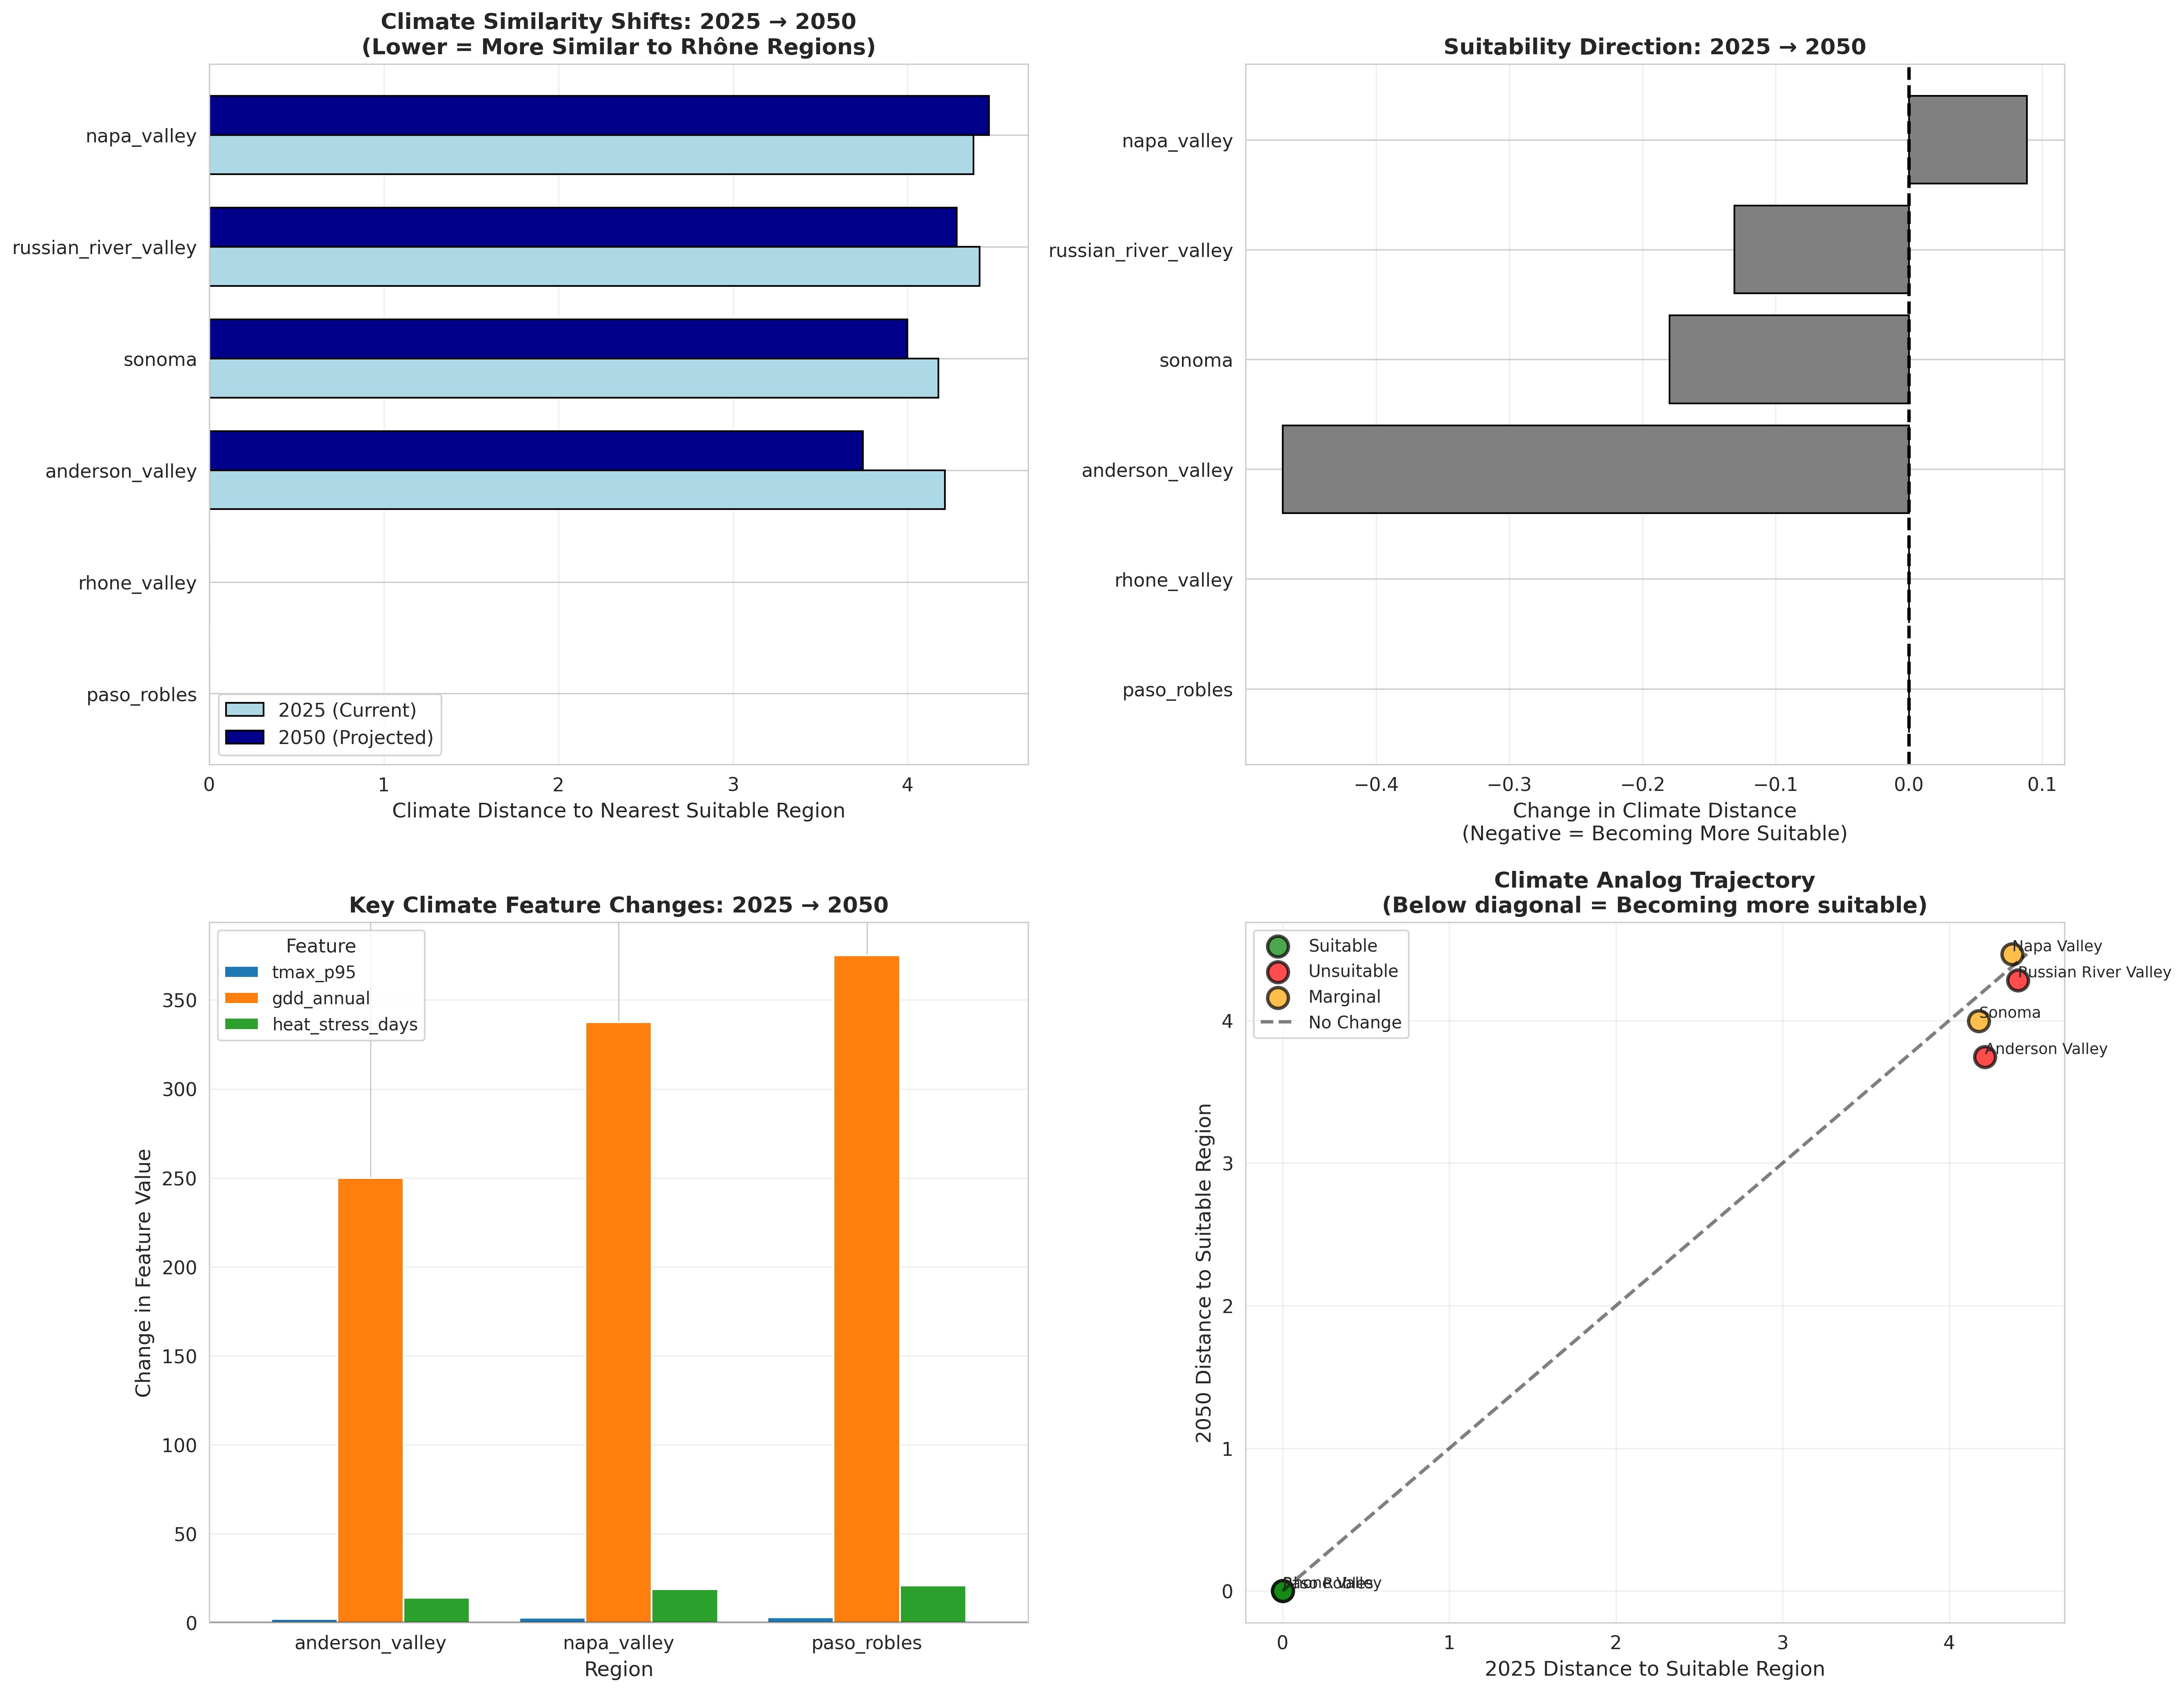
Anderson Valley: Currently the coolest region I studied. By 2050, its climate becomes 11% more similar to Rhône-suitable patterns. It's warming from "too cool" toward the sweet spot.
Russian River Valley: The coastal influence provides some buffering, but still shows 3% improvement in climate similarity. The ocean's moderating effect means warming is more gradual.
Sonoma: Gradually warming toward suitability with 4% improvement. A steady shift.
Napa Valley: Surprisingly shows minimal change (0%). It's already at a marginal point and warming doesn't necessarily move it in the right direction.
These aren't predictions of certainty — they're indications of trend. Anderson Valley showing the strongest shift makes intuitive sense: it's currently too cool, so warming helps. Napa, already warmer, may be moving toward "too warm" rather than "just right."
What I Learned Beyond the Data
This project taught me that good data science isn't about building the fanciest model — it's about asking the right questions and validating ruthlessly.
Key lessons:
- Domain knowledge is irreplaceable. Understanding viticulture helped me engineer meaningful features and recognize when model behavior didn't make sense.
- Validation strategy matters more than model choice. A simple model validated properly beats a complex model validated poorly.
- Sometimes the best ML insight is knowing when not to use ML. Climate analog matching is simpler, more interpretable, and more appropriate for this problem than deep learning.
- Data collection is underrated. I spent more time wrangling climate data than building models, and that's okay. Garbage in, garbage out.
- "Failure" can be your best teacher. The 28% spatial cross-validation result taught me more than the 96% random split ever could.
Next Steps: Where This Could Go
This project was just the beginning. With more time and resources, here's what I'd love to explore:
Expand the geographic scope: Include 12-15 California regions instead of 6. More diversity means better models.
Get site-specific data: Some vineyards within Napa ARE successfully growing Rhône varieties. Region-level labels are too coarse.
Add economic modeling: What's the ROI of replanting? How do market prices factor in?
Build an interactive tool: Imagine a web app where California winemakers could input their coordinates and get suitability projections with confidence intervals.
Extend to other varieties: Pinot Noir is already struggling with heat in traditional regions. Where will it thrive in 2050? What about Zinfandel?
The Bigger Picture
Climate change is rewriting the rules for wine production. Within our lifetimes, the wine map of the world will look different. Some traditional regions may struggle. New regions (England is already producing award-winning sparkling wines!) will emerge.
The wine industry needs tools to navigate this transition. Data science and machine learning can help — not by replacing human expertise, but by extending it. By helping winemakers see patterns in decades of climate data. By projecting futures that are difficult to imagine.
But only if we use these tools thoughtfully, validate them honestly, and recognize their limitations.
I started this project wanting to learn machine learning. I ended up learning something more valuable: that the best technical solutions understand the domain they're serving, that rigorous validation matters more than impressive metrics, and that sometimes a simpler approach is the right approach.
Also, I learned a lot about wine. And that's never a bad thing.
Interested in the code? Check out the full project on GitHub.